Understand your Enterprise GIS without writing documentation!
What is Qonda Reports?
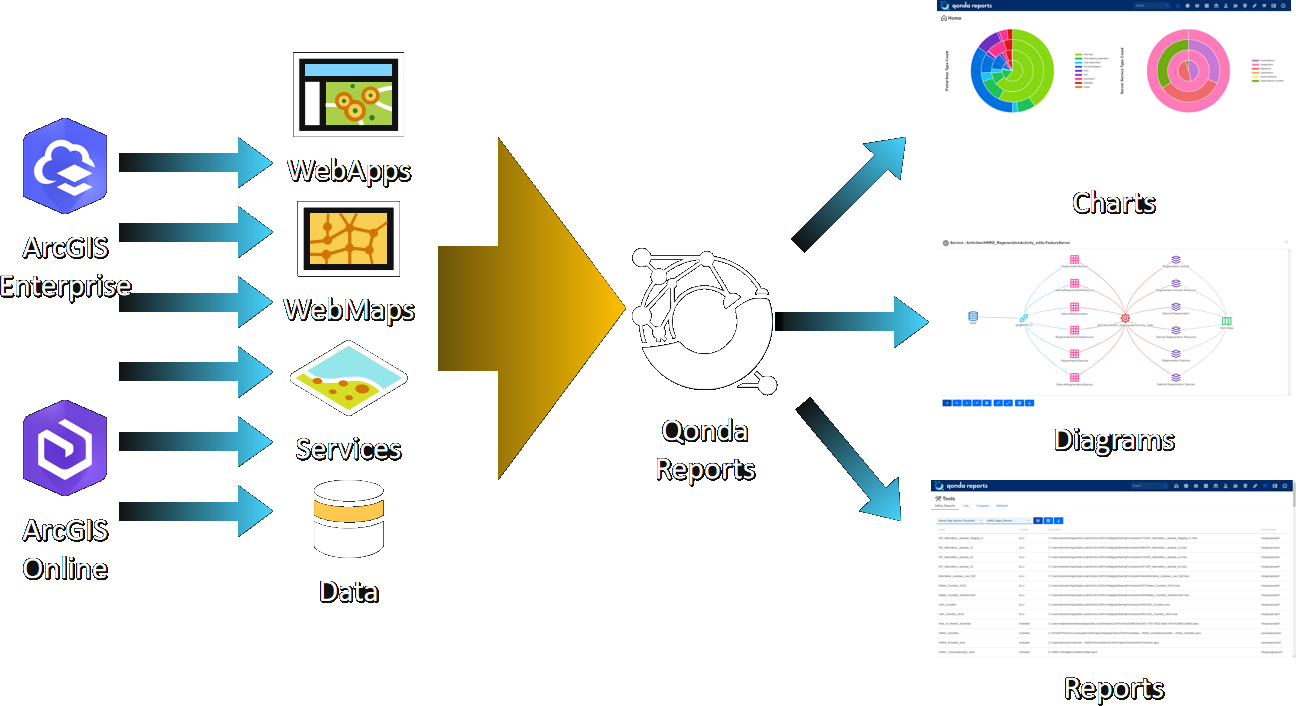
Qonda Reports is an information aggregator, exploration and reporting tool for ArcGIS Enterprise and ArcGIS Online.
It's about documenting your Enterprise GIS without lifting a finger!
What does that mean?
Qonda Reports scans your Esri systems (ArcGIS Server, Portal for ArcGIS & ArcGIS Online) and brings all that unrelated information together to help you understand your content and how they are related.
How is the information presented?
Qonda Reports allows users to views charts, tables, reports and diagrams from multiple systems in one beautifully presented interface.
Why do I need it?
Did you spend time documenting your Enterprise ArcGIS system and they're now out of date?
After a year do you still understand how your Enterprise ArcGIS system fits together?
Are you new to your organization and need to understand the Enterprise ArcGIS system?
Can you describe the relationships between your GIS services, web maps, web apps and spatial data?
Qonda Reports brings all of that into a single user interface for exploration, reporting and analysis.
How does it help me?
Has your management ever asked for or have you needed to find any of the following?
- How many web maps are there in our organization?
- Who is using all our credits?
- Which items are owned by a specific user?
- How many items aren’t shared with anyone?
- Which items were created over a year ago?
- Compare service configurations between environments?
- The number of instances for all services?
- Which web maps/apps reference a service?
- Who is creating content and consuming large amounts of space?
- Which users haven't logged in recently?
- Where data is being sourced from (e.g. database, file system)?
- Which groups a user belongs to?
- Custom reports (e.g. content created in the last month)?
If any of those seem familiar, then Qonda Reports can help!
Show Me More!